

#18: The best model for measuring media performance is.......
A primer on three measurement methodologies that every marketer should know


Media measurement is a complex topic. It is as much an art as science. This essay provides an overview of the current methodologies marketers leverage to assess media performance across more mature digital channels, in the hope that some of these methods get used to triangulate performance of retail media. I highlight the main advantages and disadvantages of each methodology. For brevity, I will focus on measurement of performance marketing where the goal is sales oriented, omitting considerations for brand marketing.
What are we measuring?
While a performance marketer could have a few success metrics (e.g., new customers, retained customers, volume sales, value sales), let’s assume for this example that the success metric is value sales. The goal of the marketer is to maximise the sales generated for every dollar invested in marketing - also known as Return on Ad Spend or RoAS. To maximise RoAS at an aggregate level, marketers look to answer two key questions. First, how should they allocate budgets across different media channels (e.g., Paid Social vs. Google search vs Amazon)? Second, within each channel, how should they distribute budgets (e.g., which search terms, which locations within websites)?
However, measuring RoAS robustly is difficult. This is because it is challenging to assess the causal effect of an ad on a customer’s subsequent purchase of the product. Was it really the ad that led the customer to purchase the product or would they have purchased it anyway (e.g., if they were already a loyal shopper)? And increasingly there is a challenge to even to get the data on whether the customer saw an ad due to stricter rules around customer consent.
Measurement methodologies
To measure RoAS, marketers use one or all three of the measurement methodologies described below.
1. Path-to-conversion or touch attribution
A customer will typically see an ad for a product multiple times across websites. How do we attribute a sale across several ads (aka touch points) the customer might have seen? Touch attribution assigns credit for the sale among the different touch points, using one of the following methods. You could attribute the sale to the first ad the customer engaged with (‘first-touch’) or to the last ad the customer engaged with (‘last-touch’) or equally across all ads (‘linear’) or by using more complex methods for assigning credit (‘multi-touch’, e.g., higher credit for more recent ad touchpoints). While this method requires no historical data and is usually available at major media channels, it has at least three major challenges.
First, it requires user level data across the customer journey which involve multiple touch points. This is inherently difficult because it relies on cookies. Customer may opt out of tracking cookies (which will likely get easier to do), channels may not be able to recognise if it is the same customer on two different devices when using cookies to track, and media owners will unlikely be able to track multiple touch points across websites and apps due to deprecation of third-party cookies. Second, it does not take into account the effect of non-digital channels (e.g., linear TV or out-of-home) where it is impossible to track customers and therefore exaggerates the impact of digital channels. Third, it is not scientifically robust in proving causal effect of the ad on sales.
2. Media Mix Modelling (MMM)
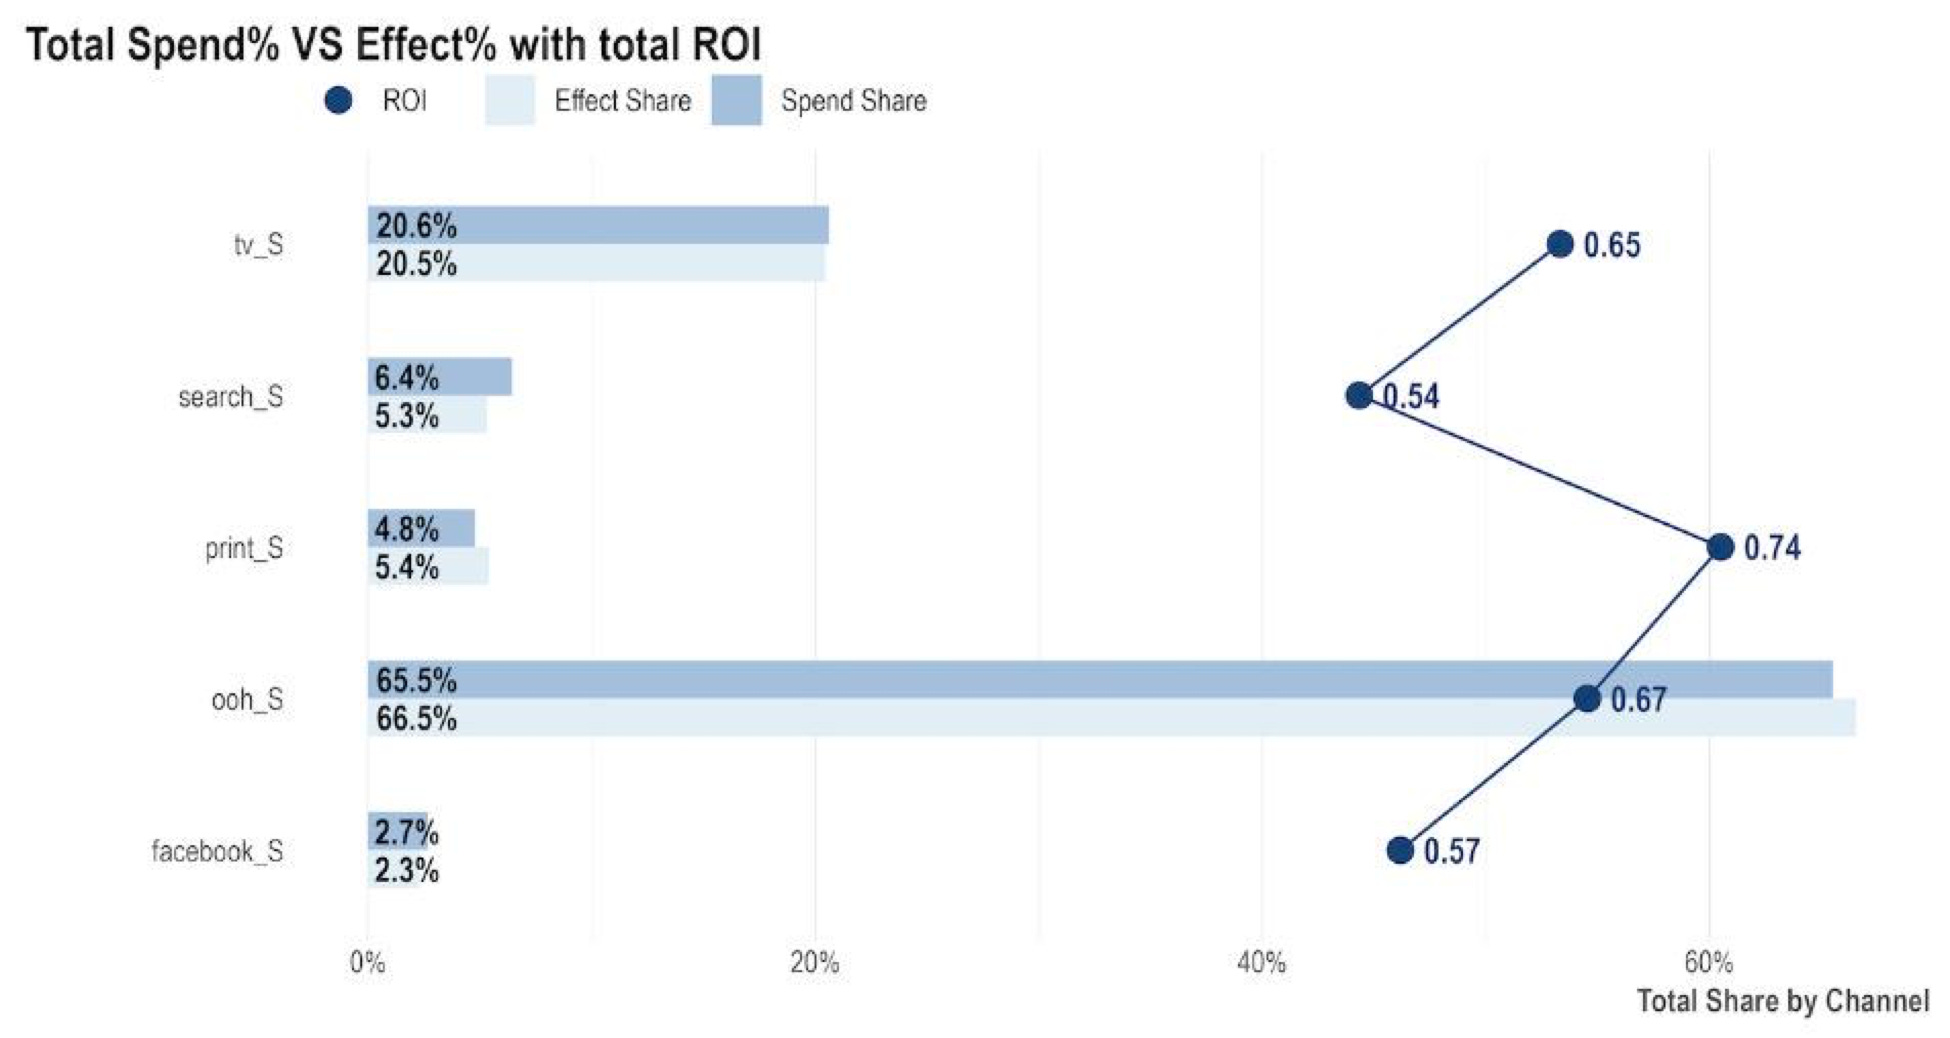
MMM leverages econometric models to understand the impact of each channel. It uses aggregate historical data of three types - sales data, channel spend data, and data on controlling factors (e.g., price of the product, seasonality, competitor activity). The model tries to detect how sales vary for changes in spend for each channel, controlling for factors like seasonality. The output of the model is the RoAS of each channel. Below is an example of output from Robyn’s guide. For example, it shows that Facebook contributed to 2.3% of overall sales for the advertiser, while its overall share of marketing spend was 2.7%, with a RoAS of 0.57 (every dollar of marketing spend gives 57c in sales value).
There are many advantages of MMMs. It can estimate the impact of non-digital channels such as out-of-home as it does not rely on tracking individual customers. It is less reliant on data from the media channel. Hence, it can also be applied to measure performance at many retail media outlets which do not share performance data today.
However, it requires a fair amount of historical data - some experts suggest at least two years of historical data with weekly frequency. It also requires leveraging experts in marketing science / statistics. It can take some time to build an effective MMM, even if you leverage open source models like Meta’s Robyn or Google’s LightWeight MMM. Further, it may not be helpful for tactical decisions such as optimising campaigns within a channel which may require more frequent inputs. For these reasons, we typically see only the most mature marketers adopt MMM to decompose all sales into baseline and incremental sales from ads, and to then understand incremental sales from each ad channel separately.
3. Holdout / Incrementality testing
Incrementality testing involves creating two groups for a test. The first group is the group you activate your campaign against (‘test group’) while the second group is the one you holdout from the campaign (‘control’ or ‘holdout’). These groups are typically created based on customer or geographic dimension (e.g., some geographies see the ad, while other geographies with similar characteristics do not see the ad). Under the assumption that these two groups have been created randomly, we can measure how much extra sales came from the test group (who saw the ad) compared to the holdout group (who didn’t see the ad).
Scientifically, this is superior to the other models in measuring casuality. It is also easier to implement than MMM. However, it has its challenges. First, some channels (like most of retail media) don’t offer incrementality testing. Second, channels need to have a certain size of users to do incrementality testing robustly. Third, experiment design and execution could get complex and may require advanced data science capabilities. Fourth, this method only provides impact for a snapshot in time – for example, the incremental impact today might be different to incremental impact in a month because competitor activities might vary across months. Finally, incrementality testing would likely show much lower RoAS, which could lead to reducing marketing spend on some channels, leading to lower revenue.
The best model is……
Unfortunately, no single model can be prescribed given each have their cons. Most experts suggest using a unified or triangulated model instead of a single model to understand RoAS. For example, if multi-touch attribution gives a channel level RoAS for Meta of 1.2x, whereas MMM indicates it to be 0.6x, then the marketer can scale down the RoAS of similar campaigns at Meta by half. Alternatively, one could feed parameters from incrementality testing as assumptions into Bayesian MMM models. Marketers desperately need such triangulations (or other creative ones) for retail media. In upcoming essays, I will discuss some easier triangulations to start with for retail media marketers.
PS: For those wanting to go deep into incrementality testing, I suggest reading this recent essay from Prof. Dr. Koen Pauwels