Introduction
In my previous post, I discussed how business leaders can use top-down sizing with industry benchmarks, calibrated to eight key factors, for setting their retail media ambition. I also argued that top-down sizing is quick, and when used properly, it can offer comparable prediction accuracy as bottom-up sizing. However, the industry often uses bottom-up sizing. In this post, I discuss briefly how bottom-up sizing can be used to produce more reliable estimates.
Bottom-up sizing is used both to estimate the potential of a new retail media business and to estimate the full value of existing media inventory for established businesses.1 At a high level, this approach requires estimating four variables - impressions2, utilisation3, click-through rate4, and CPC/CPMs5, and putting them together in a multiplicative model.6 Except for impressions, which the retailer can estimate based on its traffic and ad placements, the other variables require external benchmarks.
Bottom-up sizing estimates can vary significantly
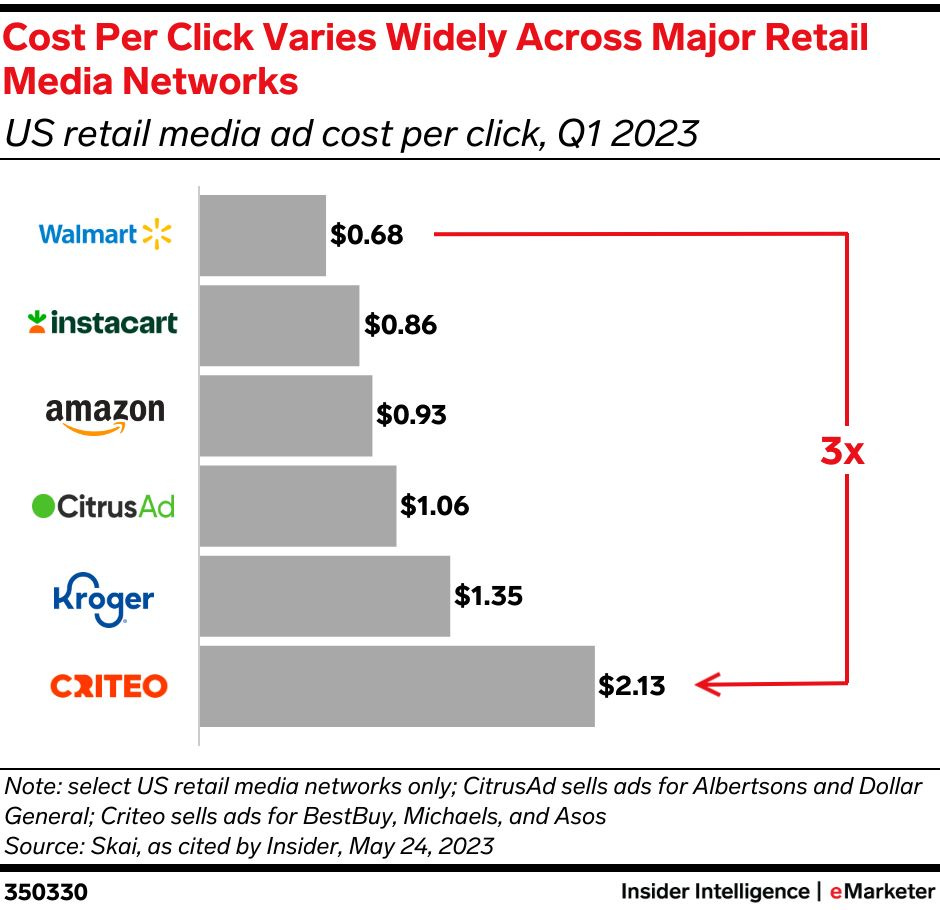
Most retailers leverage third-party vendors (typically adtech providers or consultants) for obtaining external benchmarks for the variables or to perform the entire bottom-up calculation. However, the full calculation, as described above, is unlikely to produce useful results. For example, the graph below from Insider Intelligence shows that there could be a 3x difference in average CPCs across retailers in the US. Depending on which benchmark/vendor the retailer uses, the bottom-up estimate of their retail media potential could vary significantly.
It is not surprising that these benchmarks vary significantly. A number of factors affect these variables. I provide a few examples of these factors below.
Utilisation rate: Most of the factors that I highlighted in my previous post on top-down sizing (e.g., online business model, sales composition) have an impact on the utilisation variable.
Click-through rates: These could be high at a retailer if they are deploying strong personalisation algorithms or restrictive rulesets (albeit latter could reduce utilisation rates), and if their ad placements are highly visible to customers.
CPCs: These could be high at a retailer if they over-index in selling high-value items and/or they have a strong yield management programs that allow them to increase CPC price competition among brands. I have seen a strong, highly automated yield management program help double the CPCs within the same category (along with increasing the utilisation rates).
Four changes to the bottom-up sizing approach
Given the above complications, I suggest four changes to bottom-up sizing.
First, estimate impressions and obtain benchmarks for other variables at a page level (e.g., banana search page, gin search page, homepage), and then sum up the revenue estimates across pages. Focus on getting the estimates for search pages as accurate as possible as search is estimated to account for 75% of onsite advertising spend in the US7, with similar proportions expected for other geographies.
Second, apply a range for the benchmarks. Instead of using averages for each of the benchmarks, use minimum and maximum. This will give a range for the estimates derived from bottom-up sizing.
Third, account for the additional income from offsite media. Offsite media revenue can vary between 5-30% of total media revenue.8 Insider Intelligence has recently estimated this to be 15% in the US.9
Finally, instead of using the bottom-up estimate on its own, use it to complement the estimate from the top-down sizing approach. For example, if the top-down estimate falls outside the bottom-up range, extend the range accordingly and take the average across the wider range if a point estimate is required.
Closing thoughts
Bottom-up approach is often used by retail leaders and retail media vendors for sizing retail media potential or to estimate the value of their current inventory. Using this approach at a very high level is unlikely to provide reliable estimates. Instead, leaders should apply this approach at a more granular level (e.g., page level), use a range for the benchmarks of bottom-up variables, and use the resulting estimates to complement the estimate from top-down sizing.
There is a vary slight adjustment in the approach for the two use cases.
Total customer views (aka footfall) on each page multiplied by the number of ads on each page. This is then summed up across all pages.
The percentage of total impressions that will be paid for by advertisers. For example, while a retailer may have 1 million searches for bananas on its website, the banana search page may not have a lot of advertisements as banana producers rarely advertise and the retailer may restrict ads on the page to only those products that appear organically.
The percentage of utilised or paid impressions that led to a click from the customer. Most ad impressions are not clicked by customers. Click-through rates can vary between 0-10%.
CPC is the cost per click from a customer, and is the typical advertising price denomination for sponsored products. CPM is cost per mille or cost per thousand views, and is the typical price denomination for display ads.
Typically, sponsored products require all four variables, whereas display ads require only three (all except click through rate).
https://www.insiderintelligence.com/content/retail-media-s-growth-spurt-comes-with-growing-pains
Based on conversations with retailers across US and Europe.
https://www.insiderintelligence.com/content/retail-media-s-growth-spurt-comes-with-growing-pains


